Home Solutions
Visual Design
1 Month
Figma
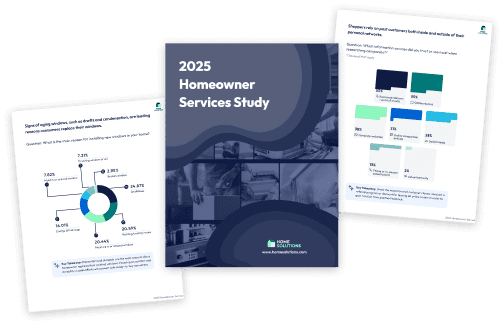
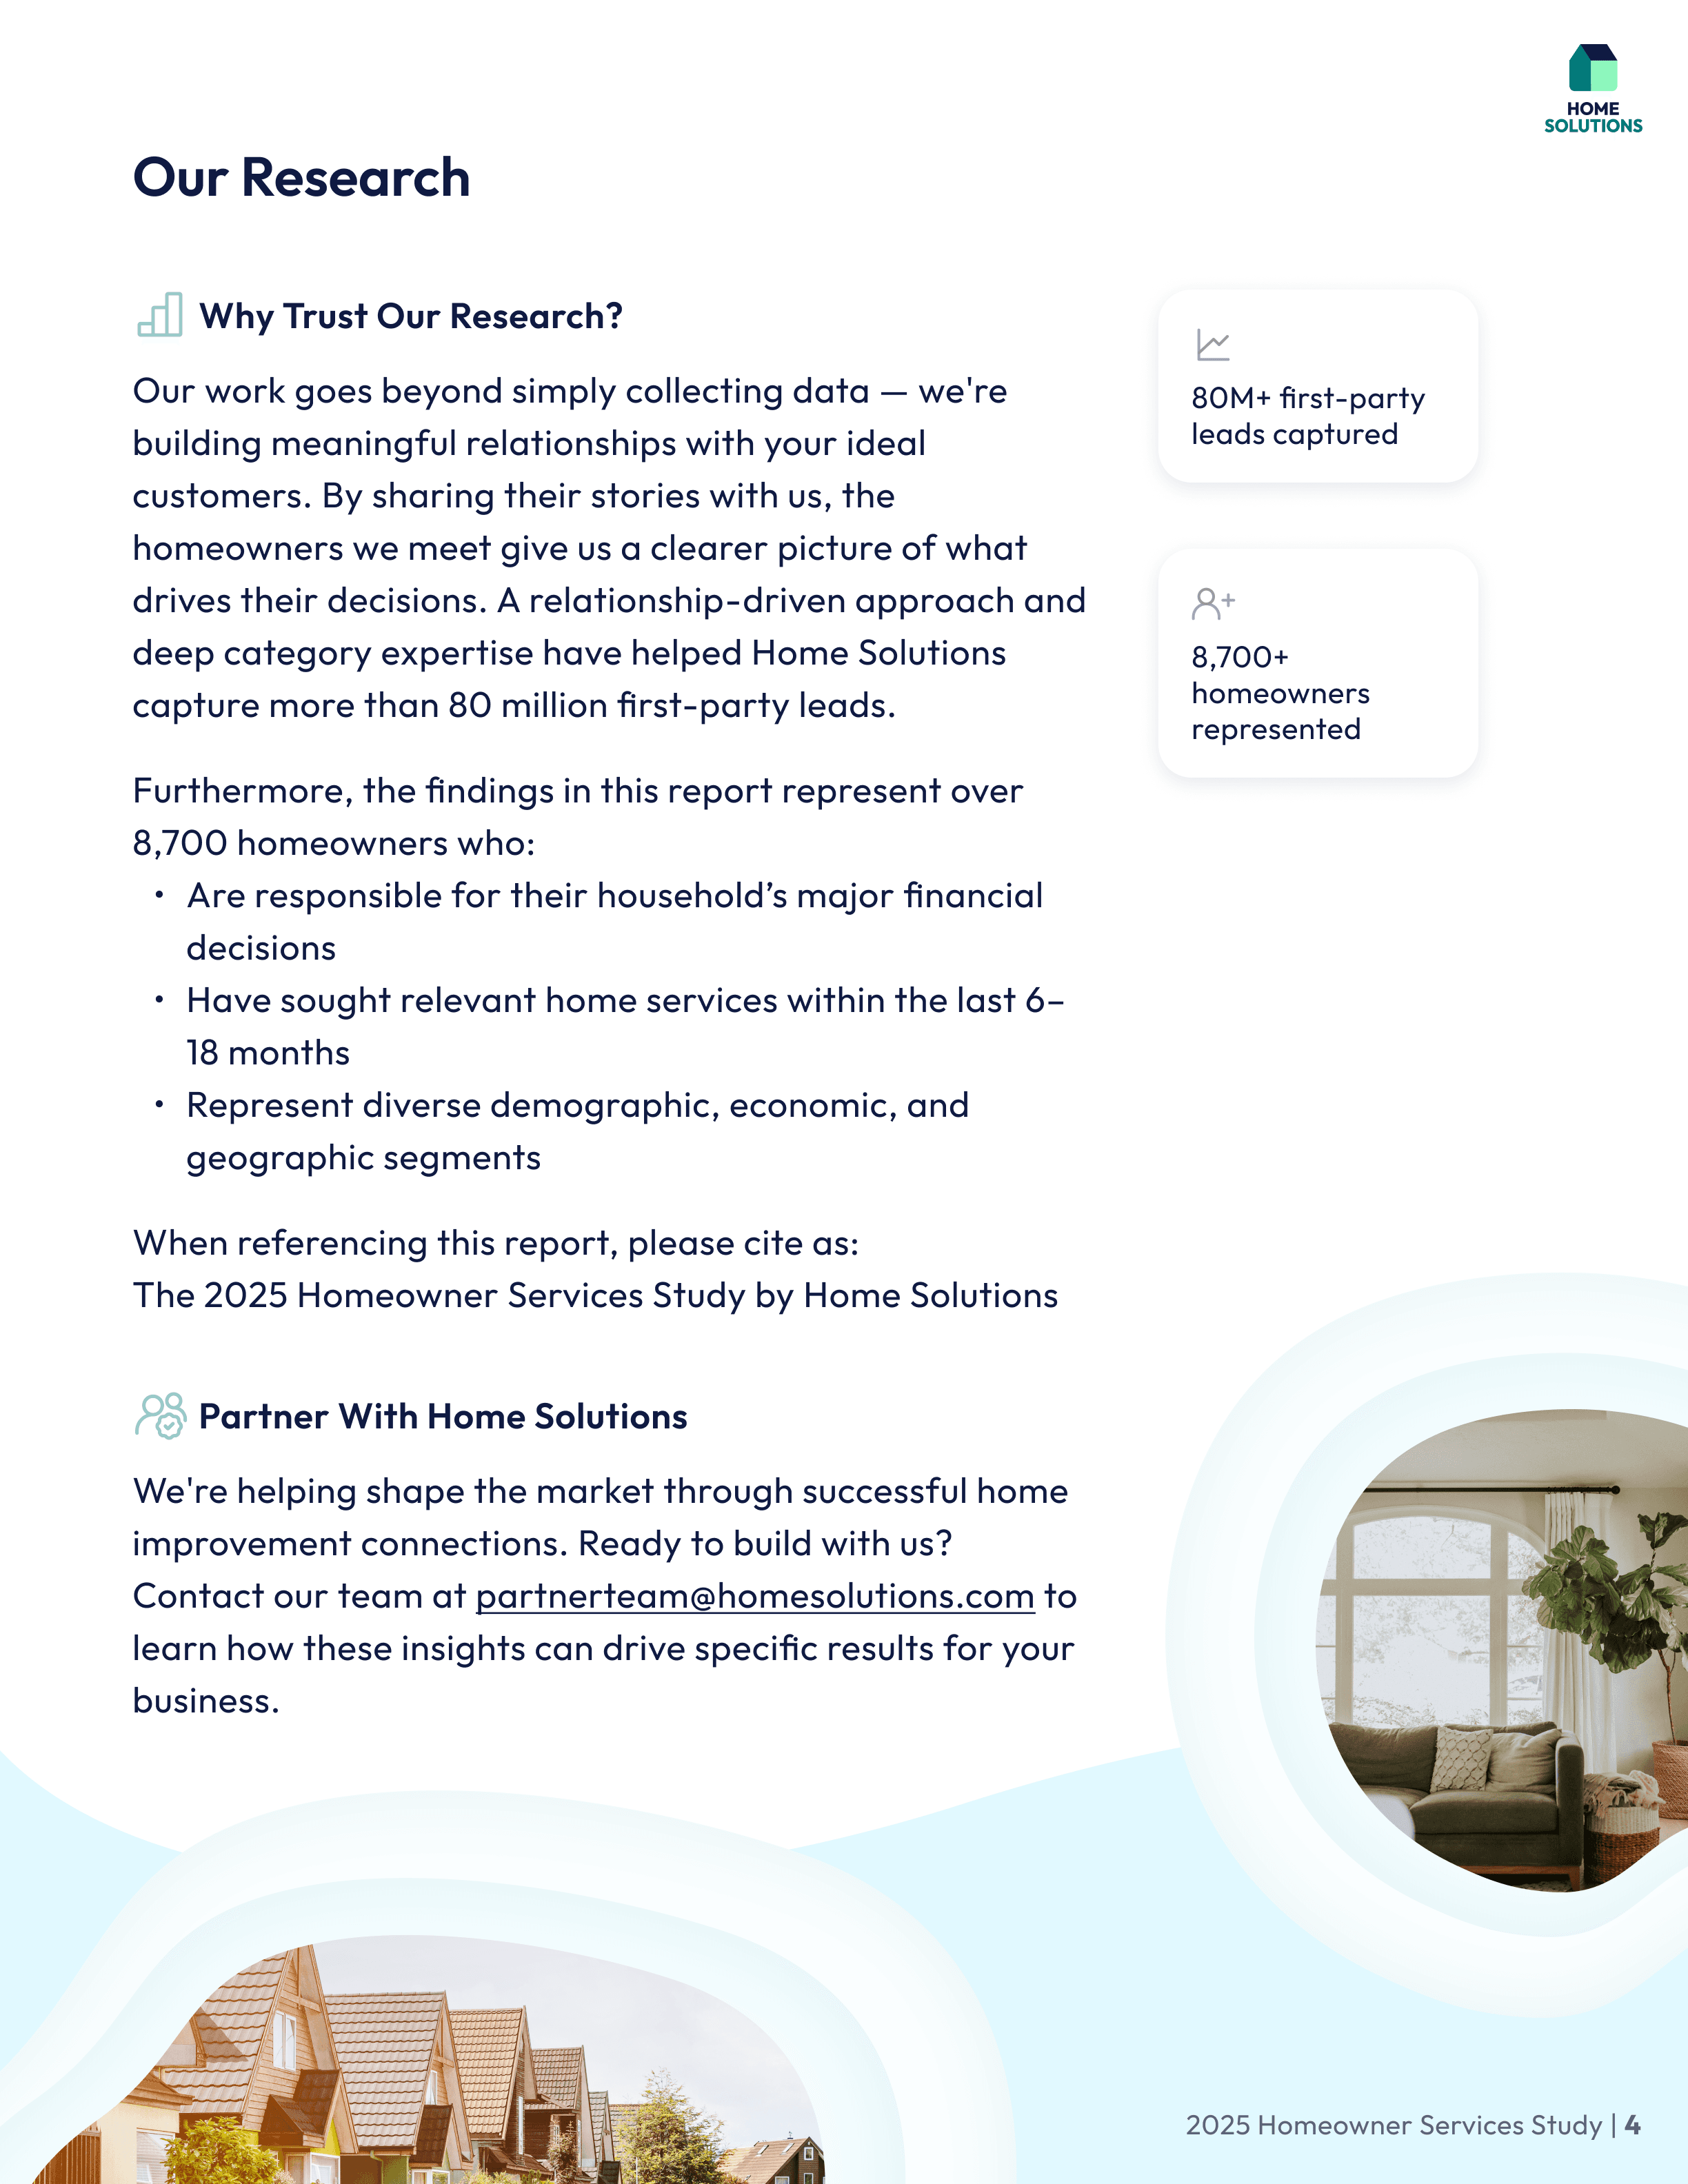
Home Solutions needed to package their proprietary consumer research into compelling materials for prospective business partners. I designed a series of six research reports—covering Gutters, Home Warranty, HVAC, Moving, Roofing, and Window Replacement—that transformed dense survey data from 8,700+ homeowners into scannable, visually engaging business intelligence. These reports demonstrated Home Solutions' market expertise and helped partners make data-driven decisions about their marketing strategies.
Sole visual designer responsible for report design, data visualization, layout, and visual identity across all six categories.

Home Solutions had valuable proprietary research from 8,700+ homeowners but no professional way to package these insights for prospective business partners.
Six research reports using a modular template system that transformed dense survey data into scannable, actionable takeaways for busy executives.
I received the research content and data along with a reference example from another company whose visual approach the stakeholders liked. My task was to adapt that aesthetic direction while creating a scalable template system that could work across multiple report categories with varying data types and findings.
Data Visualization Pages

I developed a modular design system in Figma that balanced professional credibility with visual interest. The reports needed to serve dual purposes: impressive enough to share in sales meetings while detailed enough to provide genuine strategic value. Each report follows a consistent structure—research overview, category-specific insights, general consumer trends, and partnership opportunities—but flexes to accommodate different data visualization needs across categories.
Modular template system: Created reusable components that could accommodate different content lengths and data types while maintaining visual consistency across six distinct reports
Scannable hierarchy: Used color-coded sections, bold statistics, and strategic callouts to allow executives to grasp key insights quickly without reading every word
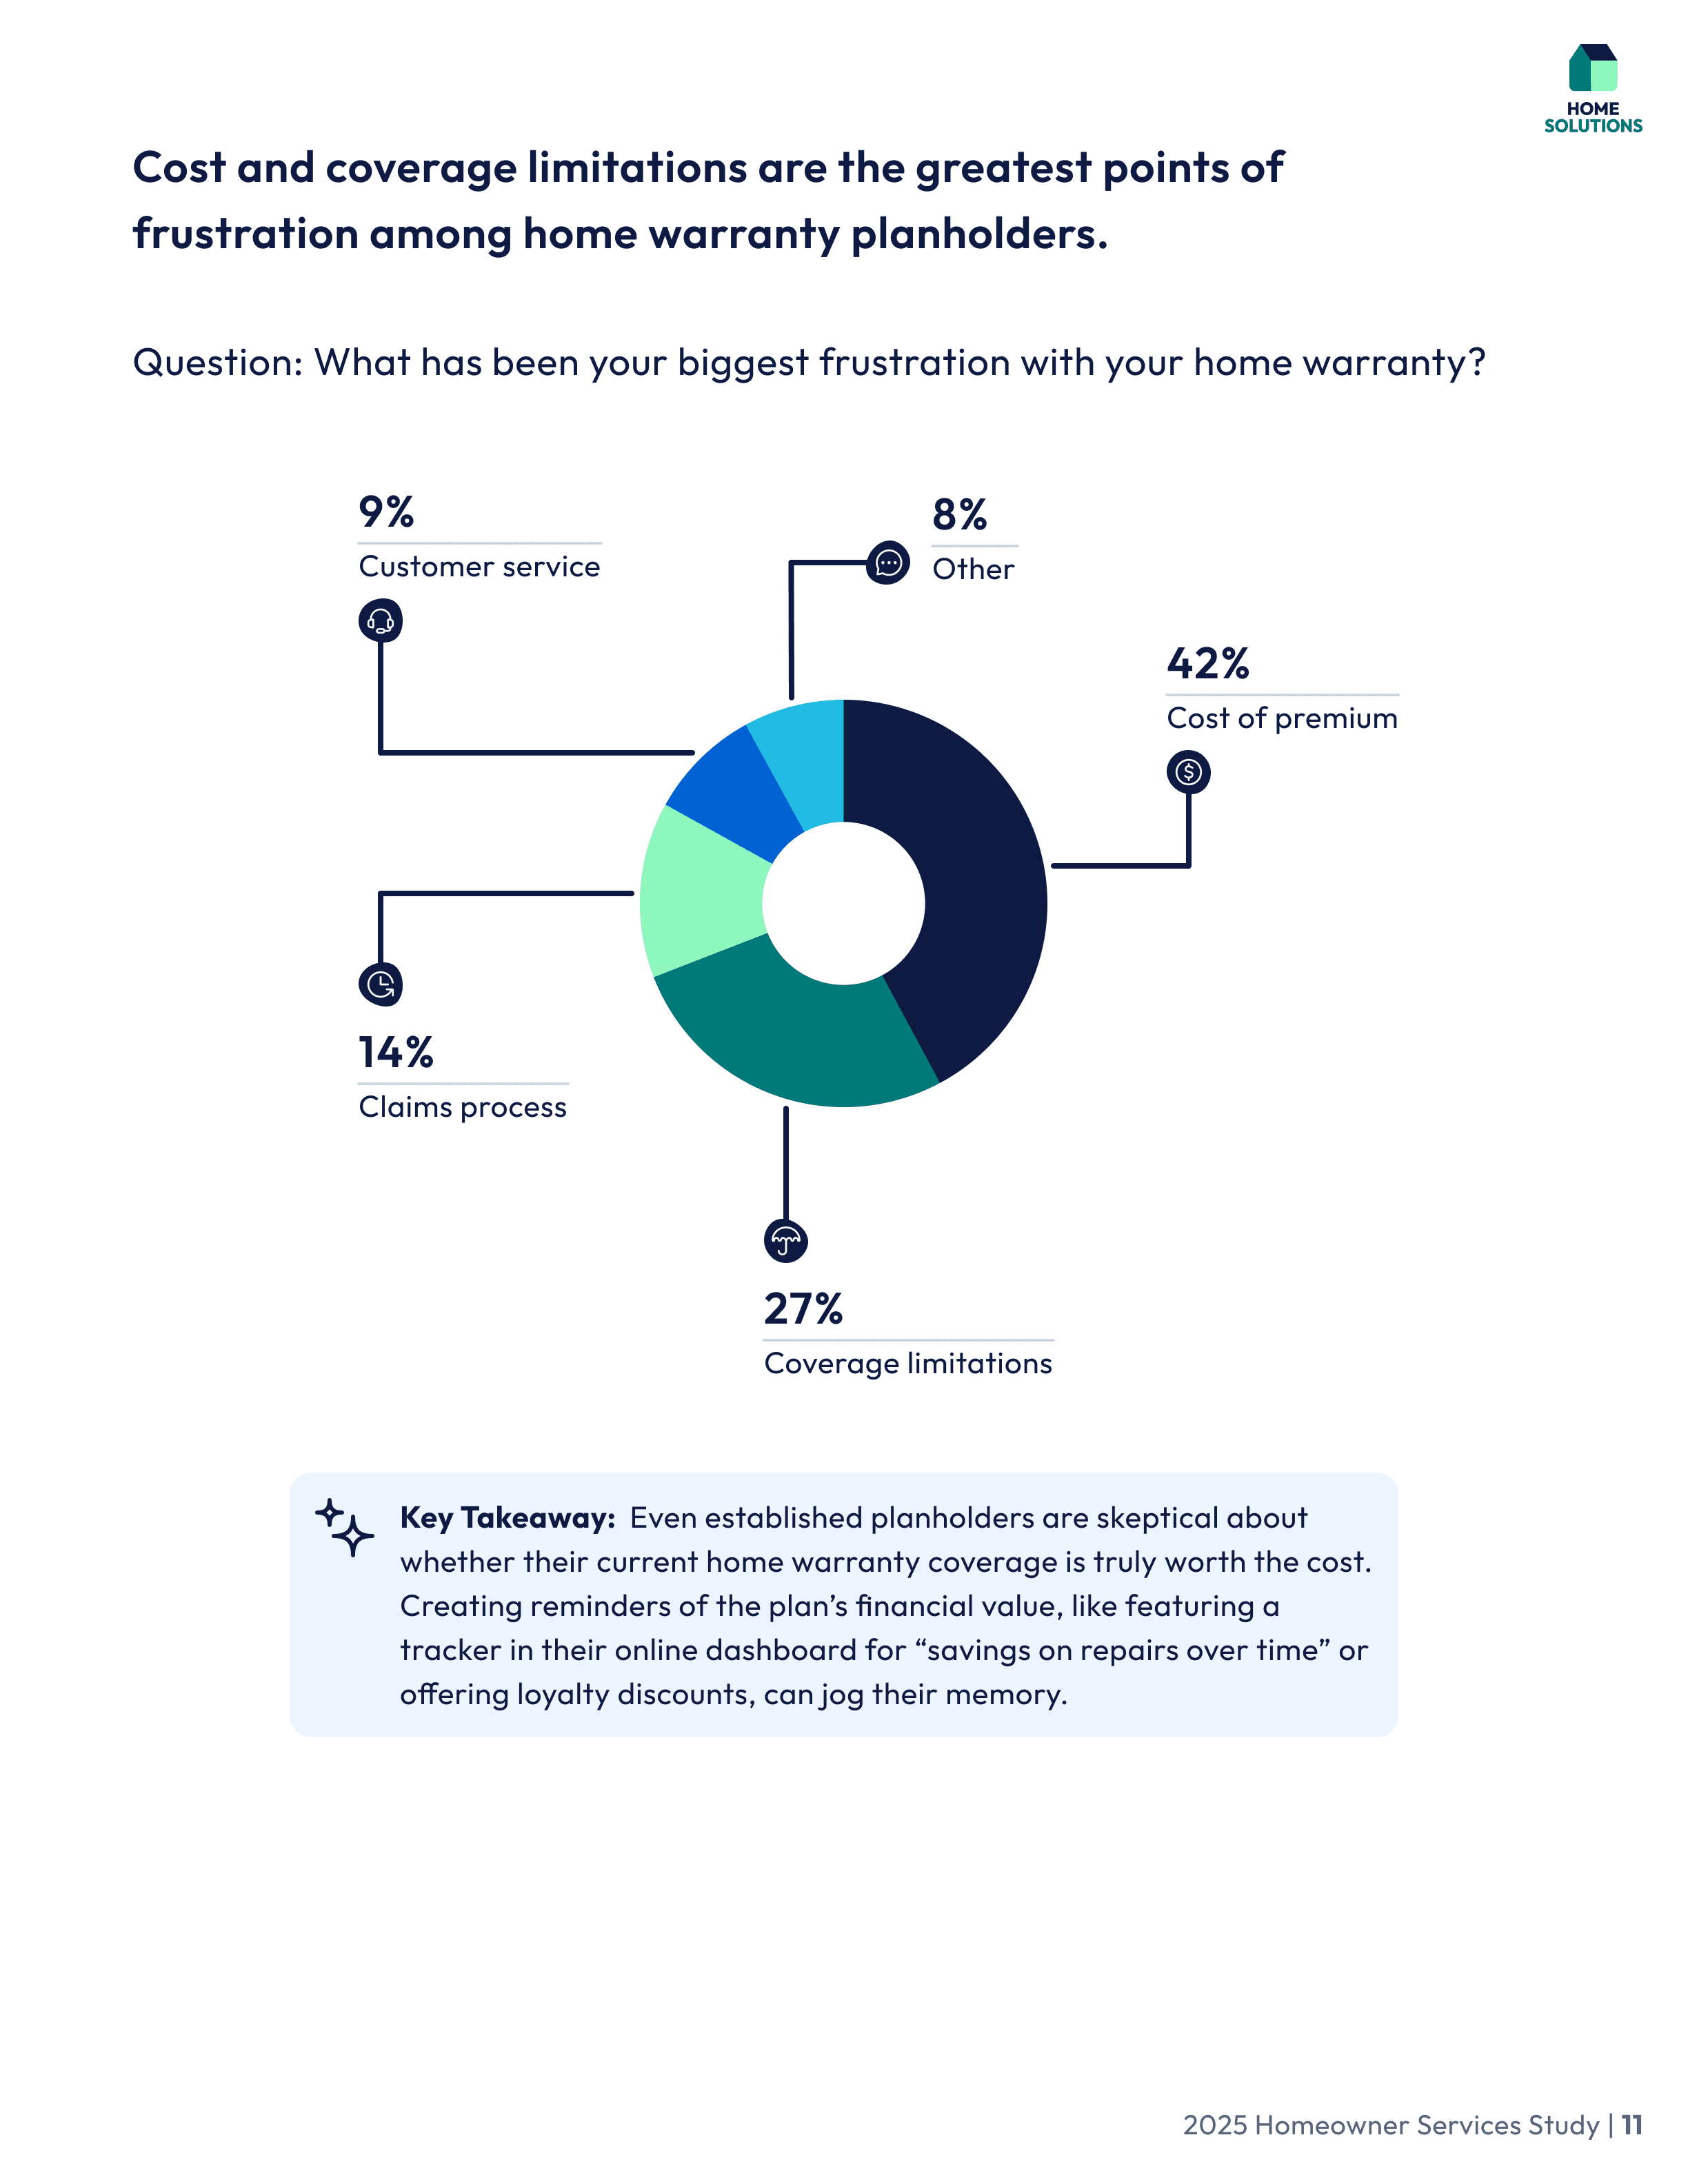
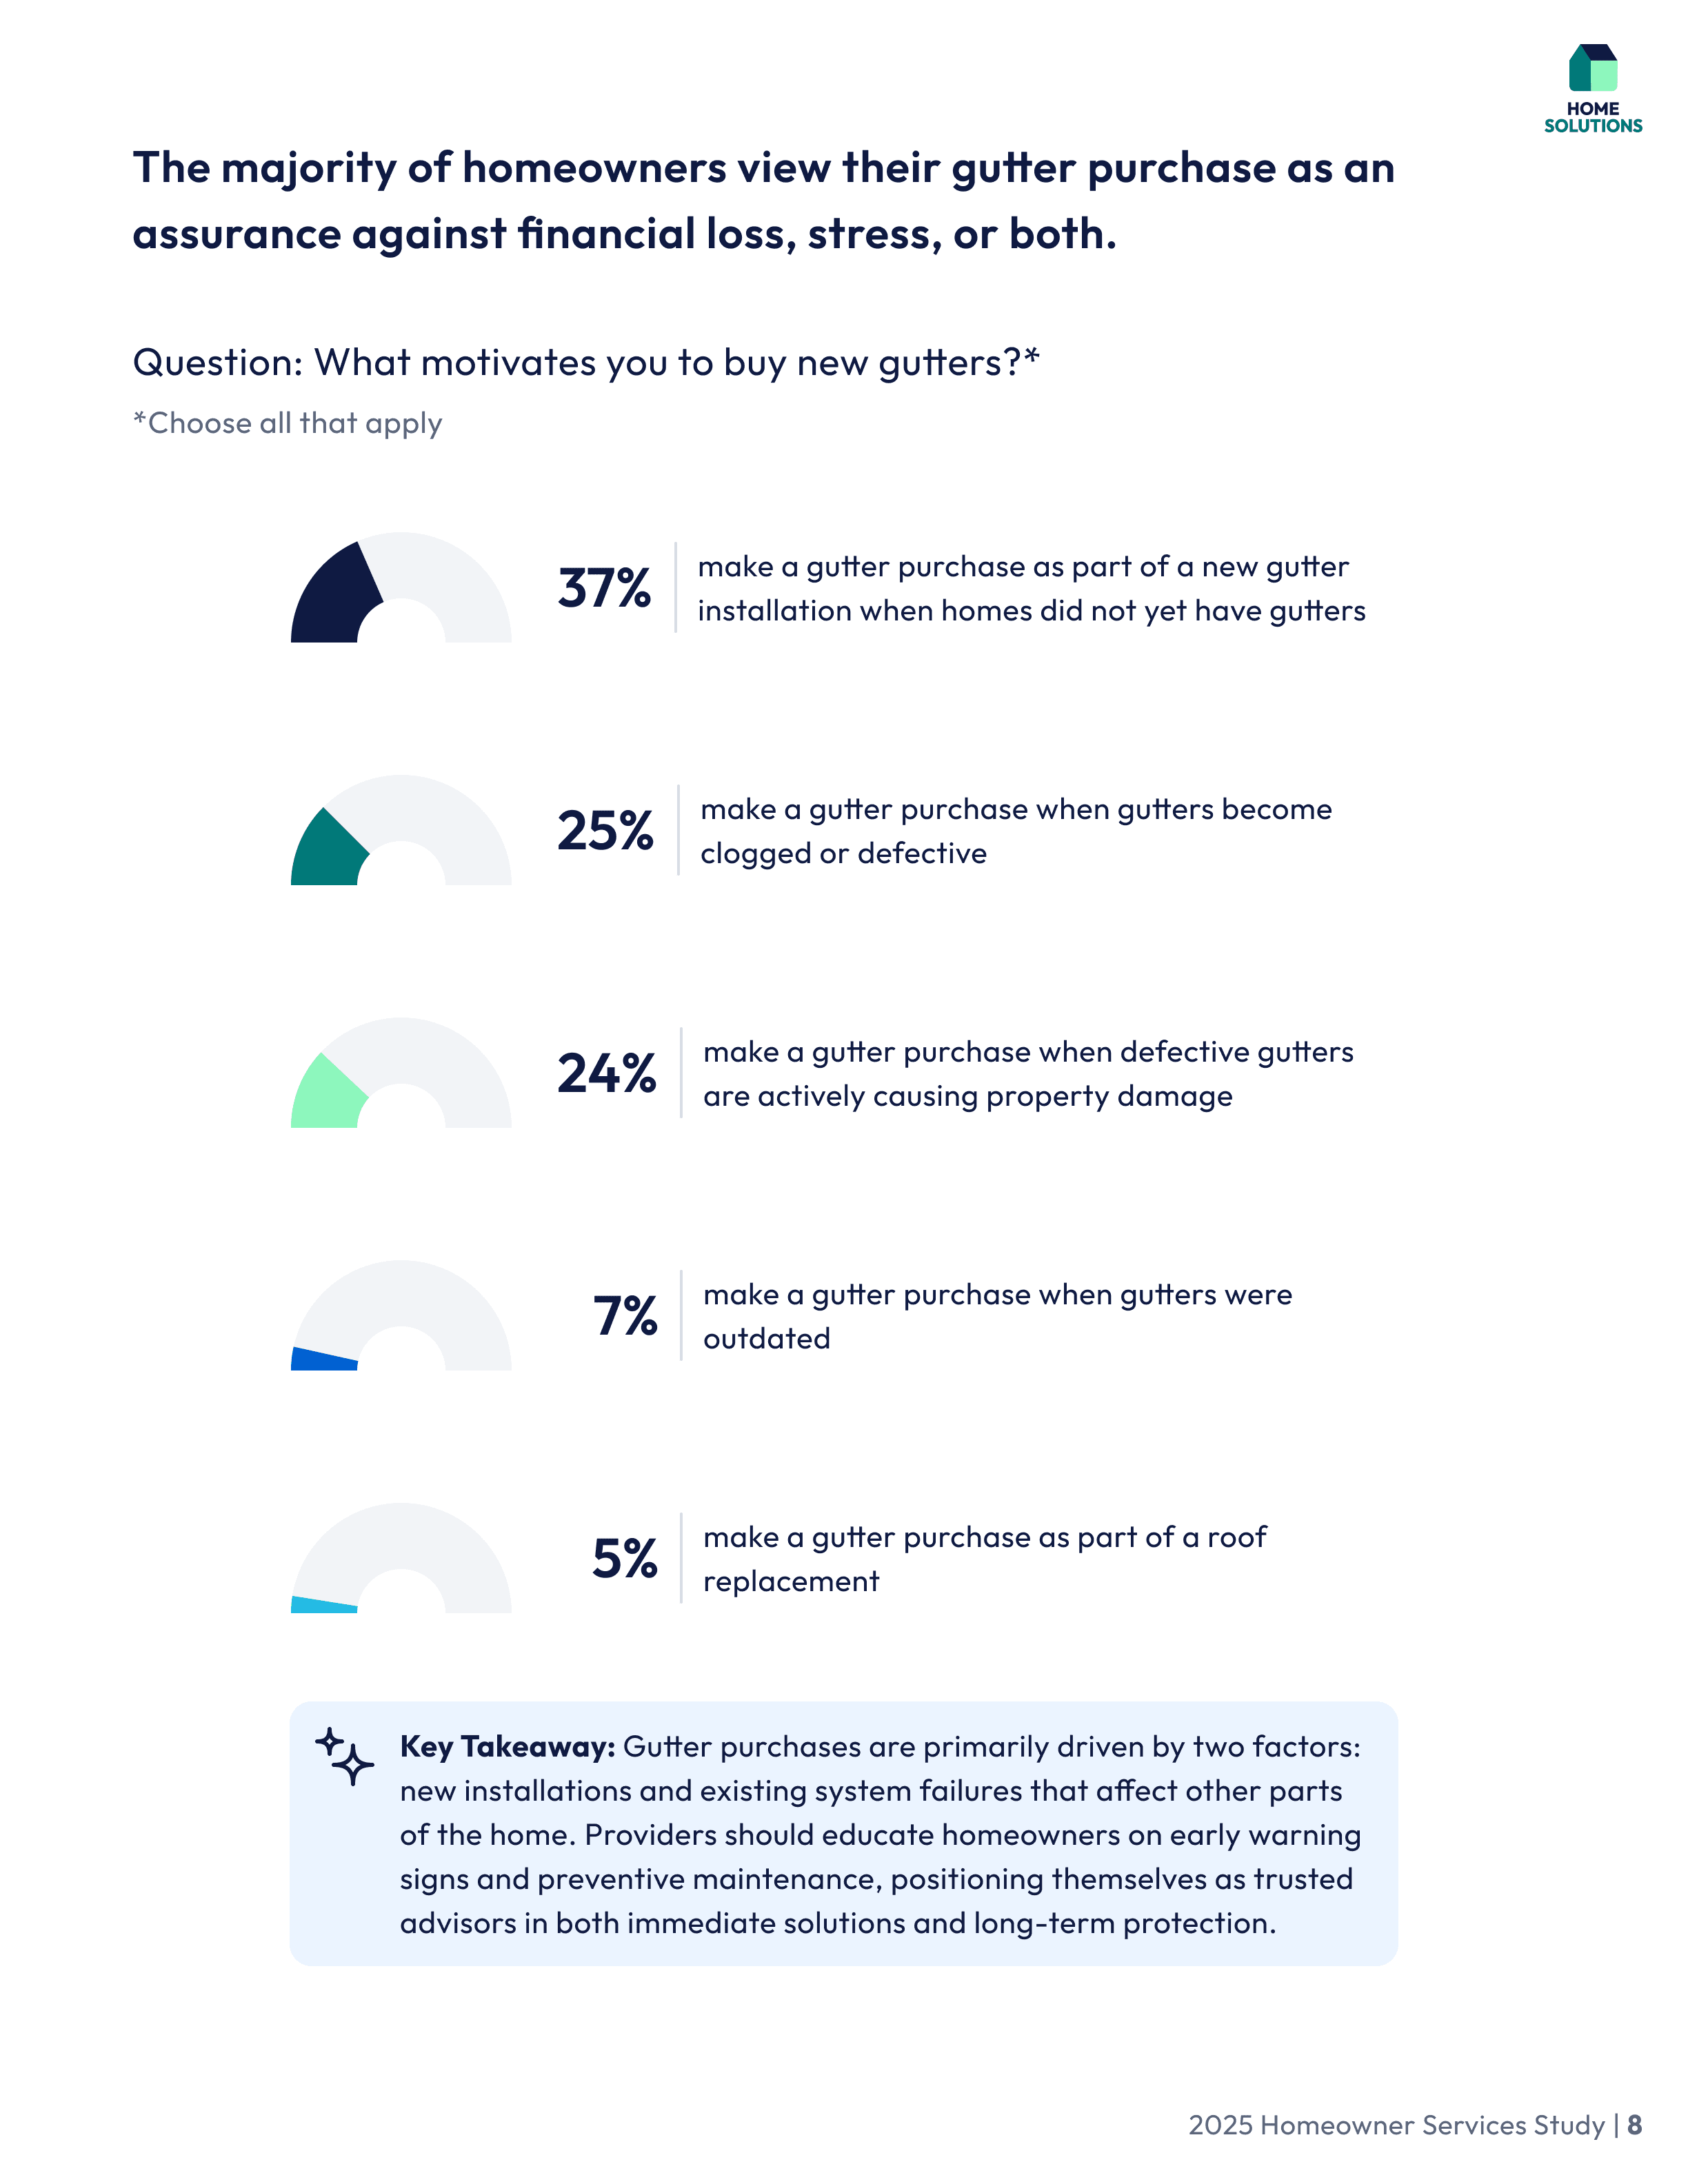
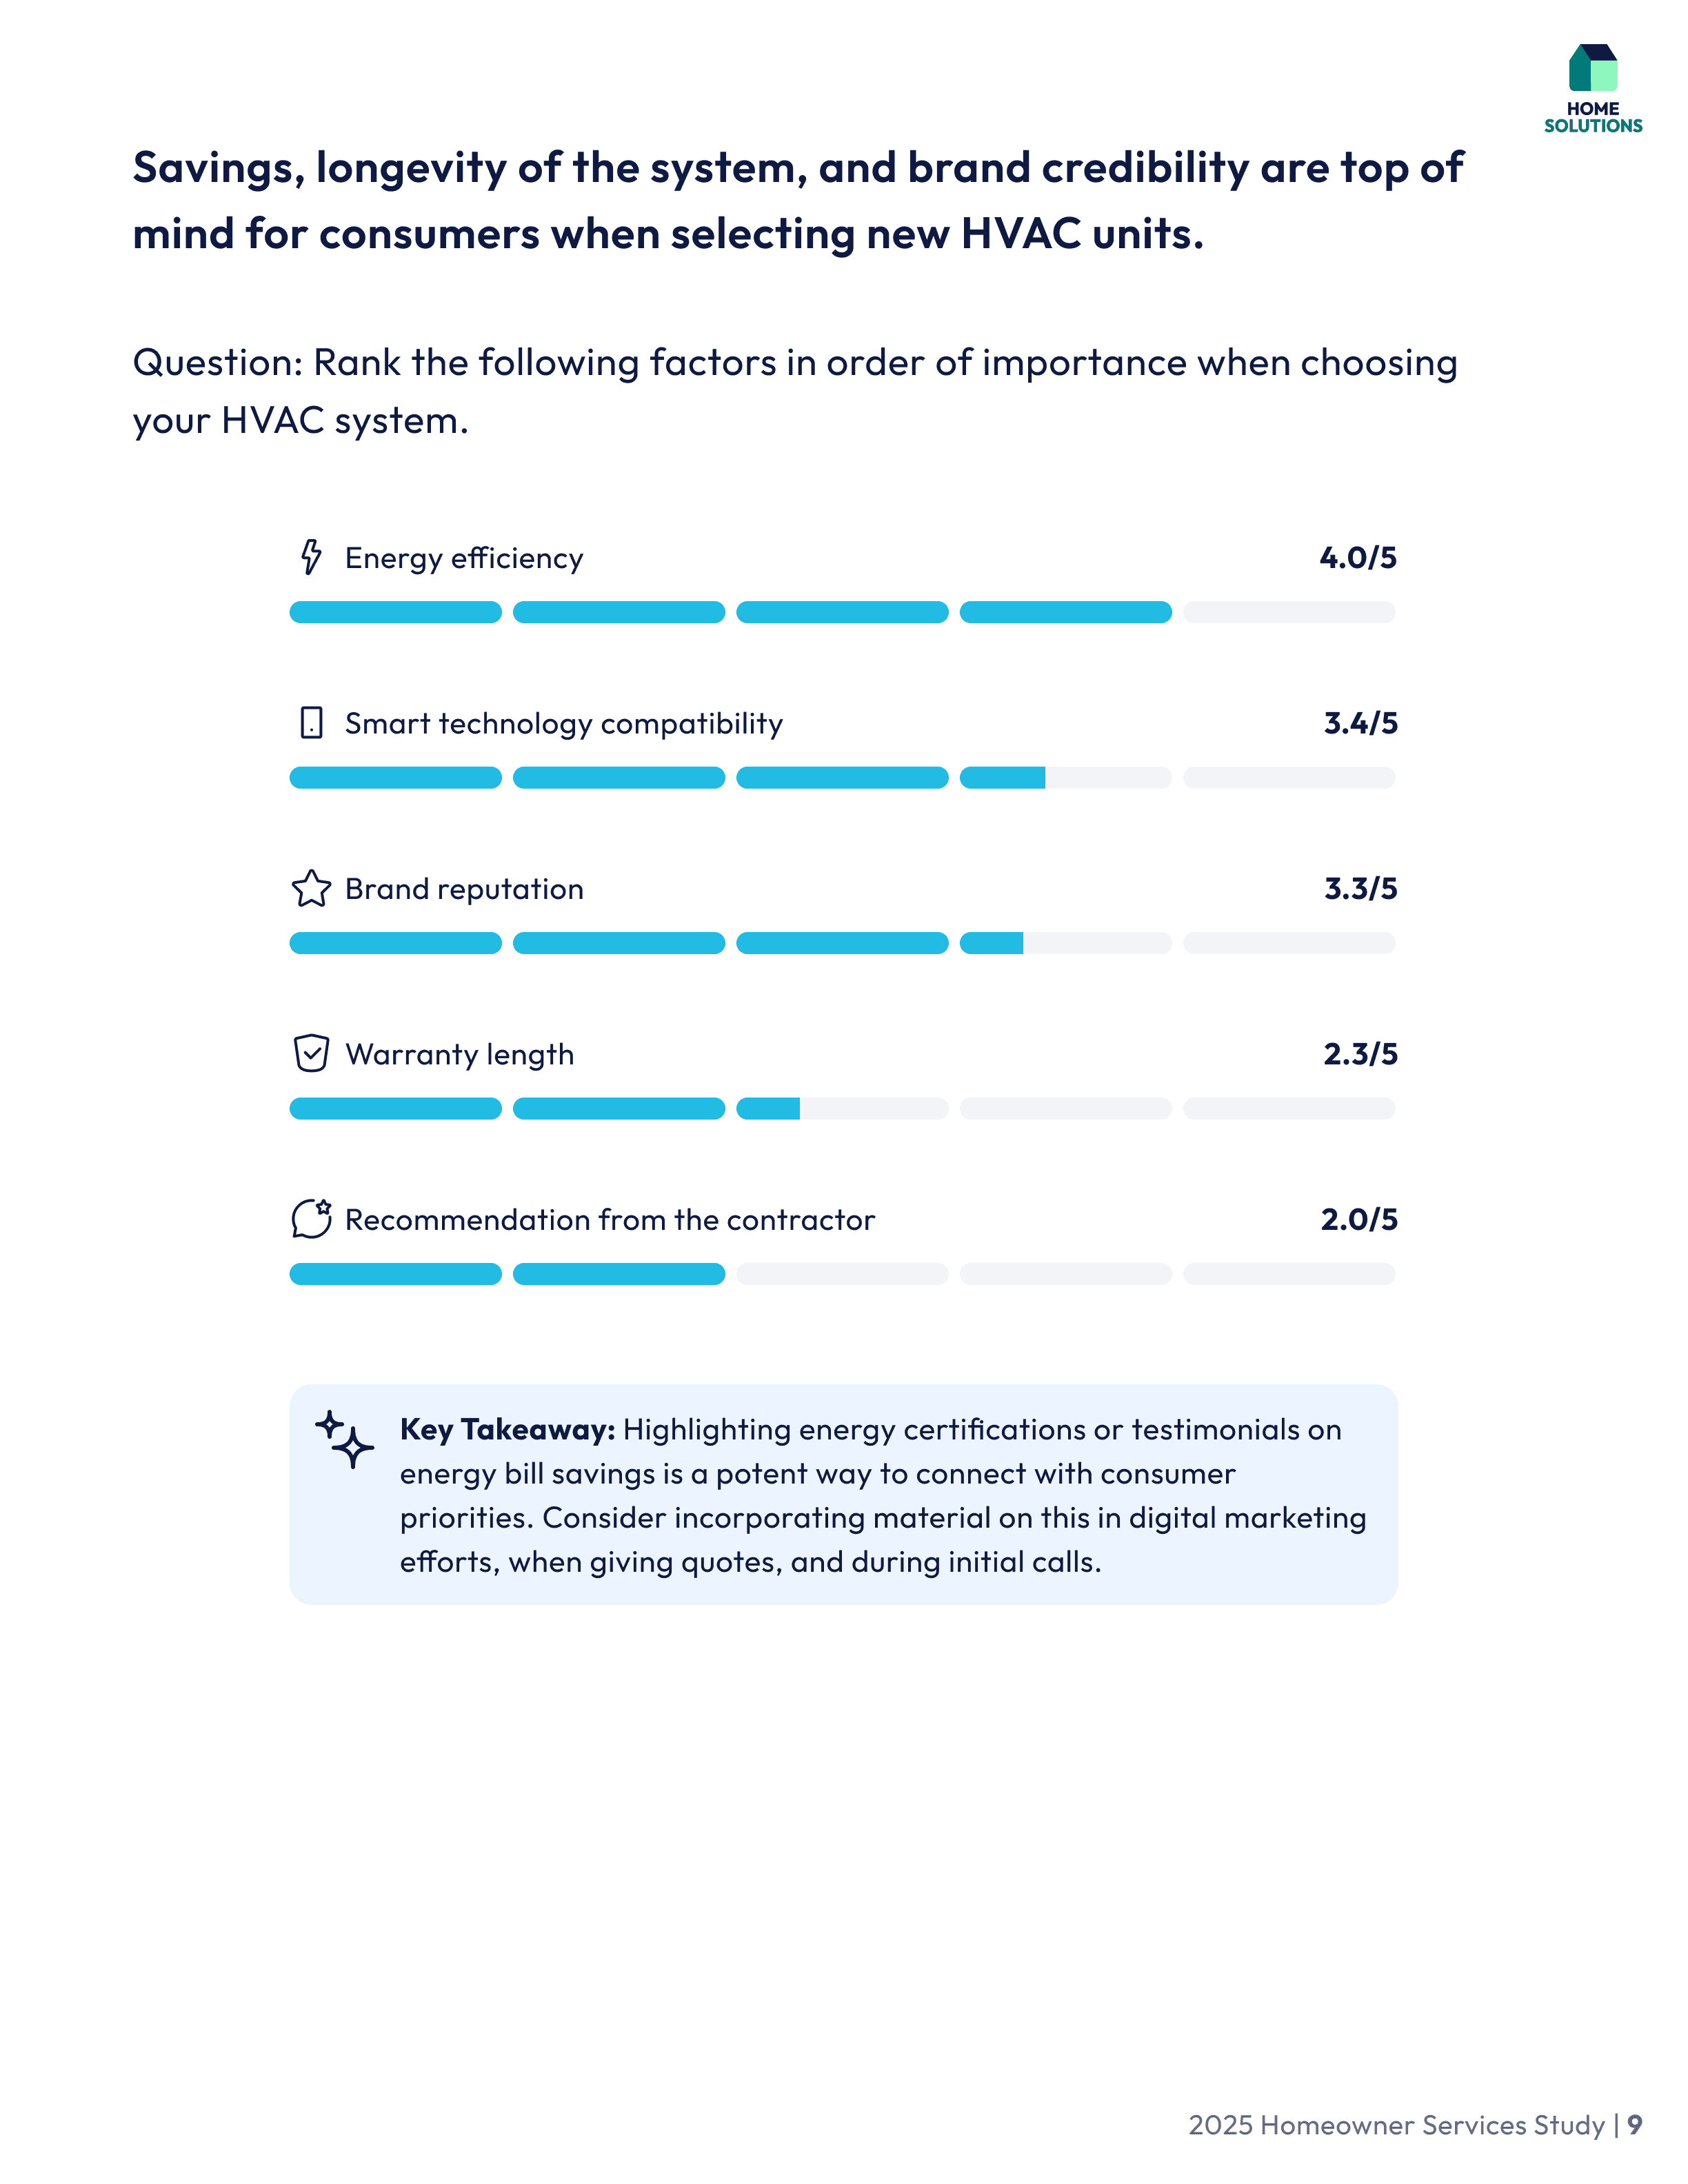
Custom data visualizations: Designed charts and graphs that simplified complex survey findings—prioritizing clarity and immediate comprehension over technical precision
Content-Heavy Pages


Windows Example
All Reports
Impact
Outcome
Delivered six professional research reports used in partnership sales and marketing
Created a scalable design system that can accommodate future research categories
Established Home Solutions' visual identity for B2B marketing materials